
Building Capability
Chapter 6: The Proof of Value
Before you read — by the end of this chapter you will understand:
- What “proof of value” actually means — and what it is not
- How to choose the right metric for your first phase
- Why the first proof of value is rarely the biggest one — and why that’s fine
- How successive small wins compound into transformational capability
Every organisation I’ve worked with has, at some point, been burned.
Maybe it was a technology project that cost twice what was budgeted and delivered half what was promised. Maybe it was a consultant who produced a beautiful strategy document that sat on a shelf. Maybe it was an internal initiative that launched with great fanfare, consumed eighteen months of everyone’s time, and quietly failed to be adopted.
Whatever the specifics, the result is the same: a deep and entirely reasonable scepticism about whether this kind of investment actually pays off.
I understand that scepticism. I share it. I’ve been part of engagements that didn’t go the way they should have. I’ve seen what happens when the wrong things get built in the wrong sequence for the wrong reasons.
The proof of value isn’t just a commercial milestone. It’s the answer to that scepticism. It’s the thing that earns the right to continue.
What Proof of Value Actually Means
Let me be precise, because this phrase gets used loosely and it matters to get it right.
Proof of value is not a prototype or a demo. It’s not a pilot that only works under controlled conditions. It’s not a minimum viable product in the sense of something half-finished that you call good enough.
Proof of value is a real thing that genuinely works in the real world, that produces a result the organisation can measure, point to, and build on.
It’s not the final system. It doesn’t have to solve every problem or cover every use case. But what it does have to do is actually deliver for the people using it, in a way that is meaningfully better than what they had before.
The minimum bar I use is simple: does this change something real for someone real? Not “would this theoretically be better?” but does it, in practice, improve the experience, the outcome, or the efficiency of the people it was built for?
If yes, that’s a proof of value. If no, it’s a proof of concept, which has its own place, but is a different thing.
Choosing the Right Metric
One of the decisions that determines whether a proof of value actually lands is the choice of metric. What are you trying to demonstrate, and how will you know when you’ve demonstrated it?
The instinct is usually to pick something financial: cost savings, revenue generated, return on investment. And that’s often the right call. But it’s not always the most compelling metric for a first phase.
In my experience, the most powerful proof of value metrics are the ones that are:
Visible. Something people can see and feel, not just calculate. If the metric requires a complex spreadsheet to justify, it will always be contested. If it’s something that changes how people experience their working day, it’s immediate and undeniable.
Measurable before and after. You need a clear baseline. If you don’t know how long something took before you built the system, you can’t credibly claim it now takes less time. Measuring the before is as important as measuring the after.
Relevant to the right audience. The metric needs to resonate with whoever is making the decision to continue the investment. For a board, that might be financial. For an operations team, it might be volume or quality. For a sales team, it might be cycle time. Know your audience.
Common proof of value metrics I see across different contexts include:
- Time saved per transaction: hours per week, hours per team member per month
- Volume capacity: how many more of a thing can now be processed with the same headcount
- Error rate reduction: particularly meaningful where errors have direct cost or reputational impact
- Onboarding speed: for organisations where client or staff onboarding is a meaningful bottleneck
- Revenue directly attributable: most compelling when the link is clean and obvious
The right metric depends on the specific organisation and the specific first phase. What matters is that you choose it before you start building, not after, so that the system is designed to produce it.
The Lilydale Books Case Study
This is one of my favourite examples of proof of value done right, because it illustrates something important: the first win doesn’t have to be the biggest win. It just has to be real.
After thirty years of her father building Lilydale Books into a trusted supplier of textbooks and stationery to Victorian schools, Ayesha inherited a business with strong relationships but significant manual constraints. Orders flowed through spreadsheets, booklists travelled as paper forms, and the period immediately before each school year was controlled chaos. Too many orders, too little visibility, too many errors.
The first phase we built was relatively modest: a better way to manage the back-of-house organisation of books against orders. Not glamorous. But it reduced the time the team spent managing stock before peak season significantly, reduced errors meaningfully, and gave everyone visibility they hadn’t had before.
That was the proof of value. Time saved. Errors reduced. Team capacity freed.
But here’s what matters: that first phase was also the door to the next phase. The data structures we put in place, the architecture we built on, the processes we systematised were designed with the broader vision in mind. And so when we moved to phase two, a parent-facing portal that allowed families to complete the entire school onboarding process online including book ordering, payments, and required forms, we weren’t starting from scratch. We were extending a foundation.
Phase two was transformational in a way phase one wasn’t. It changed the client experience entirely. Parents who had previously navigated complicated ordering processes across multiple children and subjects could now do everything in one place. Teachers who had spent hours managing booklist administration could redirect that time to teaching. It removed a category of friction from the most stressful period in a family’s school year.
The metric for phase one was operational: time saved, errors reduced, team capacity freed. The metric for phase two was commercial: direct revenue growth and competitive positioning against larger players with generic online catalogues.
Both were valid. Both were real. But phase two only happened because phase one proved the value of the approach, and because phase one was built with phase two already in mind.
The Bright Finance Case Study
A different example, because the metric was different, and the constraint was different.
Bright Finance helped homeowners navigate the complexity of offset accounts and accelerated mortgage repayment strategies. The expertise was genuine and the results measurable: families consistently achieved faster loan repayment and better financial outcomes. But the delivery process consumed enormous resources. Every client engagement required manual coordination across multiple spreadsheets, quarterly meetings to update projections, and staff time spent on calculations rather than advisory conversations.
The process worked. But the operational burden meant they could only serve a limited number of clients effectively. And with interest rate fluctuations making frequent guidance more important than ever, the manual calculation process made responsive advice prohibitively expensive for many of the families who needed it most.
The first phase we built addressed this directly: a tool that automated the core calculations and scenario modelling, allowing clients to explore financial options independently and giving the advisory team immediate access to current projections without manual recalculation.
The metric was straightforward: how many clients could the team serve effectively without a proportional increase in staff hours? The answer shifted significantly. The same team could support meaningfully more client relationships, and could respond to market changes like interest rate movements in hours rather than weeks.
That was proof of value. Clear, operational, financially significant.
And the architecture behind that calculation engine became the foundation for the next phase: a client-facing portal where families could model their own scenarios, track their progress against targets, and request advisory sessions when they needed human expertise rather than routine updates. The expert capacity that had been consumed by calculation was freed for the genuinely complex conversations that justified premium advisory relationships.
Proof of Value as a Foundation, Not a Finish Line
I want to make something explicit that I think sometimes gets missed.
The proof of value is not the end of the work. It’s the beginning of the real work.
The organisations that get the most out of this approach are the ones that treat each proof of value as a signal and a springboard: a demonstration of what’s possible that earns the right to go further and faster. Every win builds credibility. Every win builds organisational confidence. Every win makes the next win easier to fund, easier to sell internally, and easier to deliver because the foundation is stronger.
The organisations that stop at the proof of value, that treat it as a completed project rather than a first step, leave most of the value on the table. They’ve opened the door and then walked away.
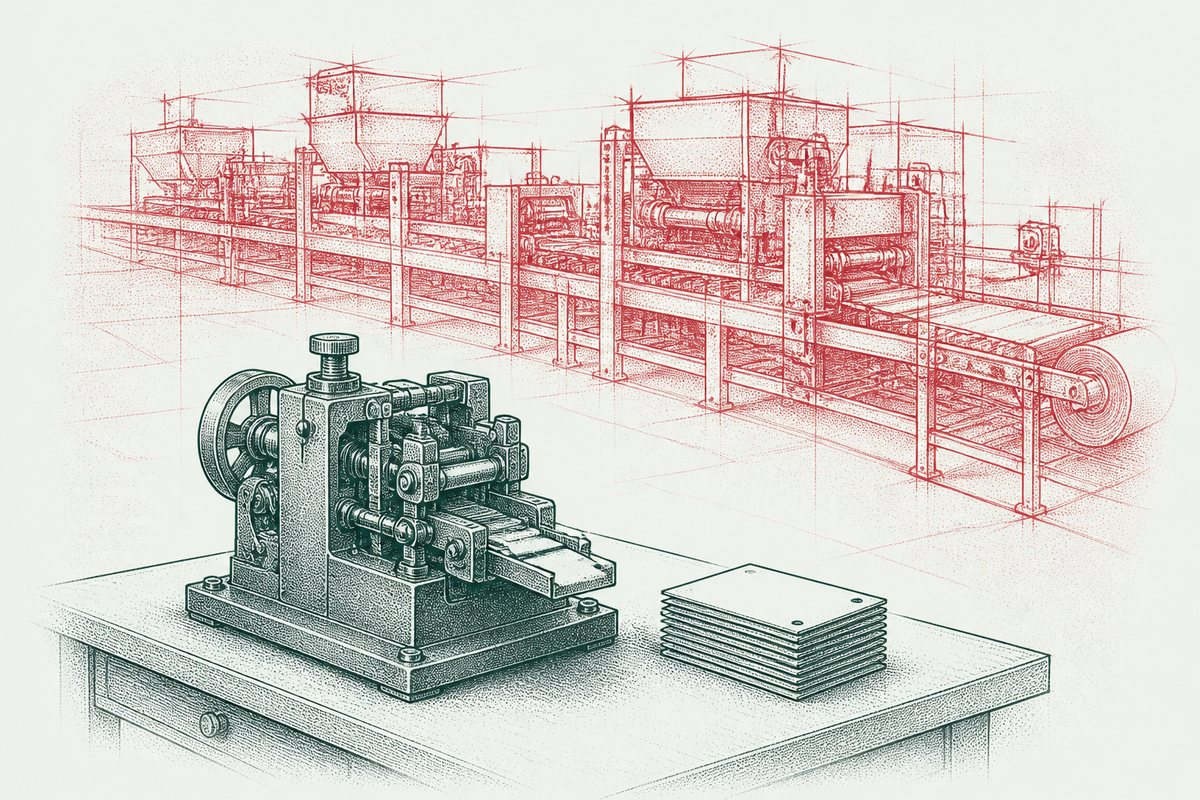
The goal is compounding capability. Small wins that build on each other, each one unlocking the next, each one moving the organisation further along the roadmap toward a genuinely different level of what it can do.
The first win is the most important. But only because it earns you the chance to go again.
Tool: The Proof of Value Designer
Before a single line of code is written, you need to know what success looks like and how you’ll prove it. This tool helps you define your proof of value in advance, so the first phase is designed to produce it rather than hoping it emerges.
It works in three parts.
Part 1 — The baseline. You define the current state of the process this phase will address. Not “it’s slow and manual” but what it actually involves, how long it takes, who does it, and what typically goes wrong. Then you put numbers on the cost: staff time, error rates, revenue impact, opportunity cost. If you’ve completed the Business Landscape Map from Chapter 2, your Process Overlays already contain this picture. The amber and red steps on those overlays are your baseline. The goal of this phase is to turn some of them green.
Part 2 — The metric. You choose the single most important thing you want to be able to demonstrate at the end of the first phase, and confirm it is visible (people can see it, not just calculate it), measurable before and after, and relevant to the audience who will decide whether to continue investing.
Part 3 — What the proof unlocks. You define what a successful first phase makes possible: what conversation it opens, what investment it justifies, what next phase it enables. This is important because it keeps the first phase connected to the broader roadmap rather than treated as a standalone project.
The tool closes with a proof of value statement: a single sentence that defines what you will have delivered, for whom, with what measurable result, and what that result makes possible next.
The detailed version of this tool, including metric benchmarks across common business types and a stakeholder communication guide, is available in the members area at [website].
This chapter's tools on this site
The full working version of each tool has its own page — and its own feedback panel, so notes on a tool stay with the tool.
The Proof of Value Designer →